Cisco Spectrum Expert: Active Site Surveys (Layer 1 Sweep)
Recommended tool of choice – Cisco Spectrum Expert
With Cisco Spectrum Expert, you can detect, classify, locate, and mitigate sources of wireless interference to optimize network performance for mobility applications.
Cisco Spectrum Expert is a combination of both hardware and software. Cisco Spectrum Expert is delivered as hardware in a PC card (CardBus) form factor and is a software install.
The Cisco Spectrum Intelligence solution includes the following components:
- Cisco Spectrum Expert Wi-Fi
- Cisco WCS (Release 4.2 or later)
- Cisco WCS Spectrum Intelligence license
- one or more Cisco Spectrum Expert Wi-Fi sensors (Release 3.2 and later)
Cisco Spectrum Expert Wi-Fi includes the following components:
- Cisco Spectrum Expert Wi-Fi sensor (CardBus form for notebooks)
- Cisco Spectrum Expert software
- Cisco Spectrum Expert antenna
Cisco Spectrum Expert – can identify all sources of RF activity (both 802.11 and non-802.11 in both bands). consists of a hardware based spectrum sensor card in CardBus format which incorporates a Spectrum Analysis Engine (SAgE) ASIC, a powerful spectrum-analyzer-on-a-chip and an associated software installed on the same workstation. For cleanair capable APs, they can be put in Spectrum Expert connect mode from the WLC and be used as a remote Cisco Spectrum Expert card, capturing all RF activity in both bands and sending all captured RF signals to the station, where the signals are analyzed with Cisco Spectrum Expert. It can also be incorporated with WCS (an additional licence is needed on the WCS) so that CSE can send the results of its scans to WCS. WCS supports a maximum of 10 reporting stations.
(SAgE) ASIC scans the RF environment to detect RF emitters. The RF activity can be represented using time domain or frequency domain graphs. An oscilloscope is a tool commonly used to visualize time domain graphs for signals. A spectrum analyzer is an example of tool providing frequency domain graphs. CSE divides the frequency in 160KHz units. The analyzer uses the Fast Fourier Transform (FFT) algorithm (or Fourier series) to represent the energy of the waves detected. The FFT algorithm defines that any wave can be expressed as a sum of sinusoids. It is used to decompose a signal into its component frequencies and their corresponding amplitude. When FFT is applied to a signal divided into a given number of subunits over a given range we can calculate the Discrete Fourier Transform (DFT) which represents the amount of energy of each sample as a number, whereby the larger the number, the more the energy detected. In CSE, DFT is applied to 160-KHz samples taken continuously between 2.4 and 2.5 GHz and between 5.15 GHz and 5.850 GHz. The Spectrum Engine captures the activity of each 160-KHz sample band for 6 microseconds ( one snapshot). It can take several snapshots over a 40-MHz-wide band (20 MHz is default) meaning that it can get 256 samples (40 MHz /160KHz) over the 40 MHz spectrum and only 128 samples over the 20 MHz wide spectrum. If the spectrum is large, then the engine stays for a few milliseconds on one 20-MHz-wide band and then moves to the next band. It typically stays 30 ms on each segment, collecting 5000 values per subunit (30 ms is 5000 x 6 microseconds), and then moves up to the next segment. The 5000 measurements are used to calculate the DFTs and represent the average energy level of that subunit over these 30 ms. This energy level is called the duty cycle ( The higher the duty cycle, the more often active RF emission was detected in these 5000 samples). The entire 2.4-GHz to 2.5-GHz and 5.15-GHz to 5.850-GHz spectrums are in turn covered in about 1 second. This is the refresh time.
FFT, FFT Plots, and Spectrograms
FFT is an efficient algorithm to compute the discrete Fourier transform (DFT) and its inverse. Discrete Fourier transform, occasionally called the finite Fourier transform, is a transform for Fourier analysis of finite-domain discrete-time signals. It is widely employed in signal processing and related fields to analyze the frequencies contained in a sampled signal, to solve
partial differential equations, and to perform other operations such as convolutions. The DFT can be computed efficiently in practice using an FFT algorithm. DFT refers to a mathematical transformation, regardless of how it is computed, while FFT refers to any one of several efficient algorithms for the DFT.
An oscilloscope is a tool commonly used to visualize real-world signals in the time domain. A spectrum analyzer is the tool commonly used to visualize real-world signals in the frequency domain.
Cisco Spectrum Expert can display FFT plots (frequency in the x-axis, and the energy level in dBm in the y-axis) which shows:
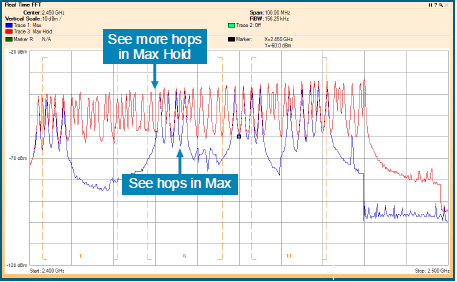
- The maximum power detected during the sweep – this shows the frequency hopers
- The average power during the sweep – this indicates the overall spectrum activity
- (max hold) The strongest of the samples observed – this shows intermittent signal
A Real-Time FFT plot displays RF power as a function of frequency, a Fourier transform of the RF spectrum. The data is direct data from SAgE. The plot can provide three different views: the average power (Avg) read during the most recent measurement interval; the maximum power (Max); or the maximum power detected at any time since the plot began running (Max Hold).
The FFT Duty Cycle plot displays the percentage of the time that the ambient RF signal is 20 dB above the noise floor and represented on a per-frequency bin basis. Duty Cycle is the percentage of time an RF signal is above
some threshold value, or the percentage of time an RF signal is detected from a network device or interferer.
The Swept Spectrogram shows data over time. Each colored horizontal line in the Swept Spectrogram plot displays the RF power or duty cycle as a function of frequency, as measured over the time of one sweep in time (typically one second). The Swept Spectrogram plot uses colors to represent RF power levels. The Color Scale options enable you to map the highest color and lowest color to specific power levels.
The Power vs. Frequency plot is also, in essence, a Fourier transform of the RF spectrum, showing the amount of RF power detected at various frequencies. The difference between the Power vs. Frequency plot and the Real-Time FFT plot is that the Power vs. Frequency plot is generated based on an analysis of SAgE data.
The Power vs. Time plot displays RF power as a function of time. It is mainly used to observe RF pulse activity.
cisco Spectrum Expert Charts
- Active Devices – Pie chart of all active devices in the spectrum
- Devices vs. Channels – stacked chart displays the number of devices per channel and frequency band. The height of the bar shows the maximum power of all interference signals.
- Devices vs. Time line chart displays the number of devices detected at different times.
- Channel Utilization bar chart displays RF duty cycle as a function of channel activity. stacked chart displays RF duty cycle as a function of channel.
- Channel Utilization vs. Time line chart displays RF duty cycle as a function of time.
- Interference Power stacked chart shows the power for each selected channel. The height of the bar shows the maximum power of all interference signals. Each bar consists of several lines representing the signal strength of a specific device type.
- Signal-to-noise ratio (SNR) chart displays the signal-to-noise ratio for each channel having access points. SNR is the ratio of a given transmitted signal to the background noise on the channel. The height of the bar above or depth of the bar below the 0 dB line indicates the SNR (in dB) for a given channel.
CSE captures the output in Cisco Spectrum Capture format (CCF) with the size being about 6MB file per hour per band. The CCF files are subject to a size limitation of 512 MB.
Setting up Cisco Spectrum Expert
- Install the Cisco Spectrum Expert software before you install the
Spectrum Expert hardware (CardBus sensor) - Attach the external omnidirectional antenna
- Insert the CardBus sensor into your PC
- Start Cisco Spectrum Expert
- Define whether the CSE card has an internal or external antenna
- Define the channels and regulatory domain that we want to monitor
- From the Cisco Spectrum menu, choose your views.
- Interference Power
- Real Time FFT
- Swept Spectrum
- FFT Duty Cycle
- Walk through the facility and start detecting interferes.
- LocateInterferers
- To minimize your effort and maximize your chances of locating the interferer, you should use a divide-and-conquer search strategy (also known as rectangular bisection).
- LocateInterferers
Typical patterns of major interference sources
- microwave ovens

- detected about 2450-MHz +/- 10-MHz range (Microwaves typically impact channels 6 to 11, but mostly channel 11)
- duty cycle of about 50 percent
- bandwidth is “only” about 1 MHz
- they do not hop and stay on the same frequency
- bad ovens can have effective isotropic radiated power (EIRP) of up to 1 watt
- The interference is short-lived but can be very complete
- Best action: do not use the affected channel
- Digital Enhanced Cordless Telecommunications (DECT) phone
- can affect 2.4-GHz and the UNII-3 bands
- Their power output EIRP may be very close to the FCC limit (4 watts EIRP or +36 dBm)
- They may use different frequencies for transmit/receive
- their frequency may change (pseudo-FH) dynamically
- Best action: replace the DECT phones with 802.11 phones
- Cordless 2.4-GHz Phone
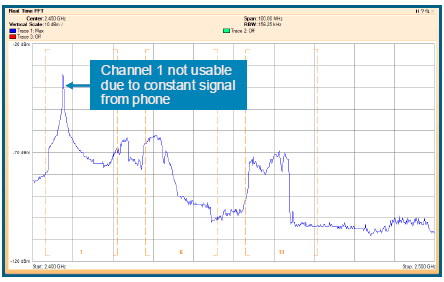
- When this phone is in use, channel 1 becomes unavailable for
Wi-Fi users. - Cordless phones that can cause interference to Wi-Fi are sold in the 2.4-GHz and 5-GHz bands.
- Best practices would be to remove these devices in a dual-band environment and replace them with cordless phones that use Digital Enhanced Cordless Telecommunications (DECT), which
run in the 1.9-GHz band, or ensure that the cordless phones being used are in a different band than the Wi-Fi band.
- When this phone is in use, channel 1 becomes unavailable for
- Cellular phones
- Do not interfere with WLAN frequencies
- Analog cameras
- use the 2.4-GHz spectrum
- characterized by heavy impact on one channel
- If they impact channel 1,6 or 11, the result is only 2 nonoverlapping channels if it impacts an intermediate channel like 4, then that means that both 1 and 6 are affected. This creates overlapping issues on neighbouring APs.
- Bluetooth
- very fast hopper (1600 hops per second)
- affects the 2.4-GHz band
- released in three different classes of radios
- Class 3 at 1mW (0 dBm) – used for consumer devices, does not interfere with Wifi normally
- Class 2 at 2.5 mW (4 dBm). – used for consumer devices, does not interfere with Wifi normally
- Class 1 devices are rated at 100 mW (20 dBm) which has power to cover up to 33 m and thus interferes with WiFi but this class is not usually used for consumer devices
- Bluetooth adds noise and reduces the SNR of the environment hence impacting WiFi negatively
- Jammer

- the Real-Time FFT window shows a constant flat signal across
several channels - They are excellent for denial of service (DoS) attacks.
- the Real-Time FFT window shows a constant flat signal across
- Co-Channel and Adjacent Channel Interference
- CCI comes from another access point located on the same
channel - ACI comes from an access point on an overlapping channel and is worse than CCI
- CCI comes from another access point located on the same


After the layer 1 Survey is over, try and determine which interferes can be removed before moving on to Layer 2 Site survey
References:
- CCNP Wireless (642-732 CUWSS) Quick Reference Guide by Jerome Henry
- IPexpert’s CCNP CUWSS Wireless Voice on Demand (642-731)
- CUWSS Student Guide v1.0
- Cisco Spectrum Expert Download
